Plotlyで書いたグラフがGithubで表示されなかったので、nbviewerを使ってみた
Abstract
Githubにコミットした Plotlyで描画したグラフを含むjupyter notebookをwebから見るために、nbviewerを使ってみた。
Introduction
Jupyter notebookをgithubにアップロードすると、matplotlibなどで描画したグラフはそのまま表示される。 しかしPlotlyを使った場合、Githubがiframeに対応していないためグラフが表示されない。
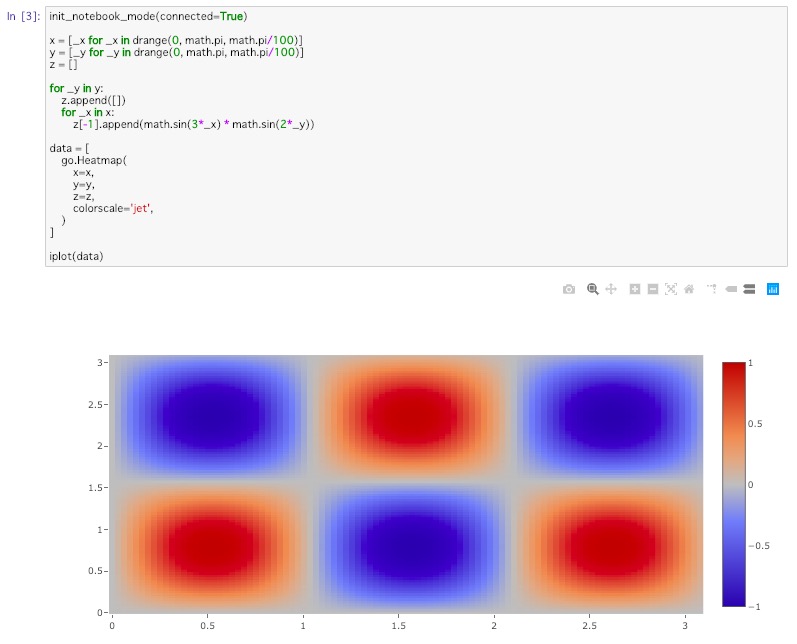
手元のJupyter notebook

Githubにアップロードした結果

過去に投稿したPlotlyを使ったjupyter notebookのグラフがgithubだと表示されないので、 nbviewerを使ってみた。
Setup and Results
nbviewerを使ってみる。

例えば、
https://github.com/s0-ma/Blog/blob/master/2019-02-09_plotly_heatmap/plotly_heatmap.ipynb
の内容を表示する場合には、githubドメインより先の部分を
https://nbviewer.jupyter.org/github/
につなげて、
https://nbviewer.jupyter.org/github/s0-ma/Blog/blob/master/2019-02-09_plotly_heatmap/plotly_heatmap.ipynb
のようにすれば良い。
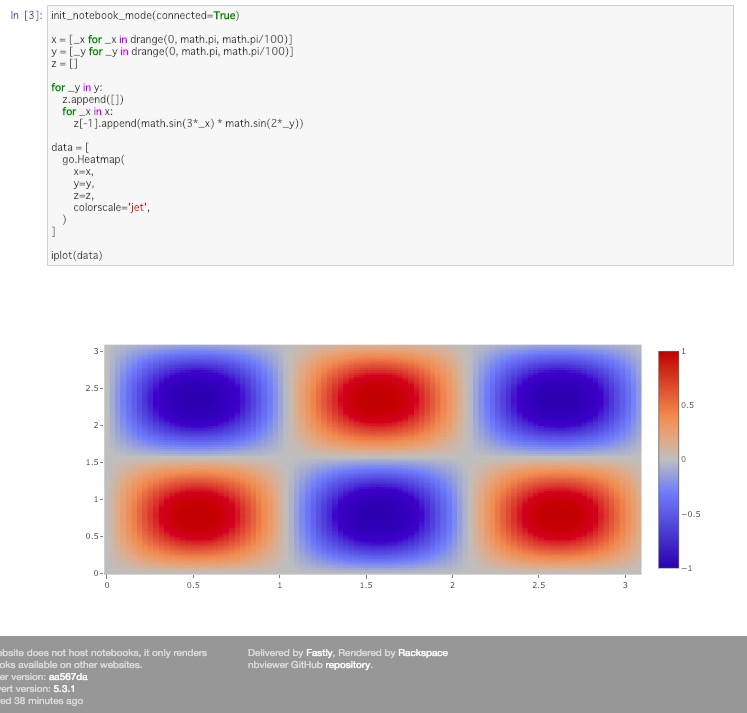
実行結果
Plotlyのグラフも表示できた。
https://nbviewer.jupyter.org/github/s0-ma/Blog/blob/master/2019-02-09_plotly_heatmap/plotly_heatmap.ipynb
